Five years is not a long time in financial planning. However, it is the shortest time-period to consider in planning a long-term portfolio that can outlive you.
In America, the world’s largest and most rewarding financial economic system, building a portfolio that outlives you is the No. 1 financial goal of parents, family leaders, and charitably inclined individuals. Data in this bar chart showing five years of history should inform your outlook for investing for the rest of your life and working toward a portfolio that survives you and your spouse.
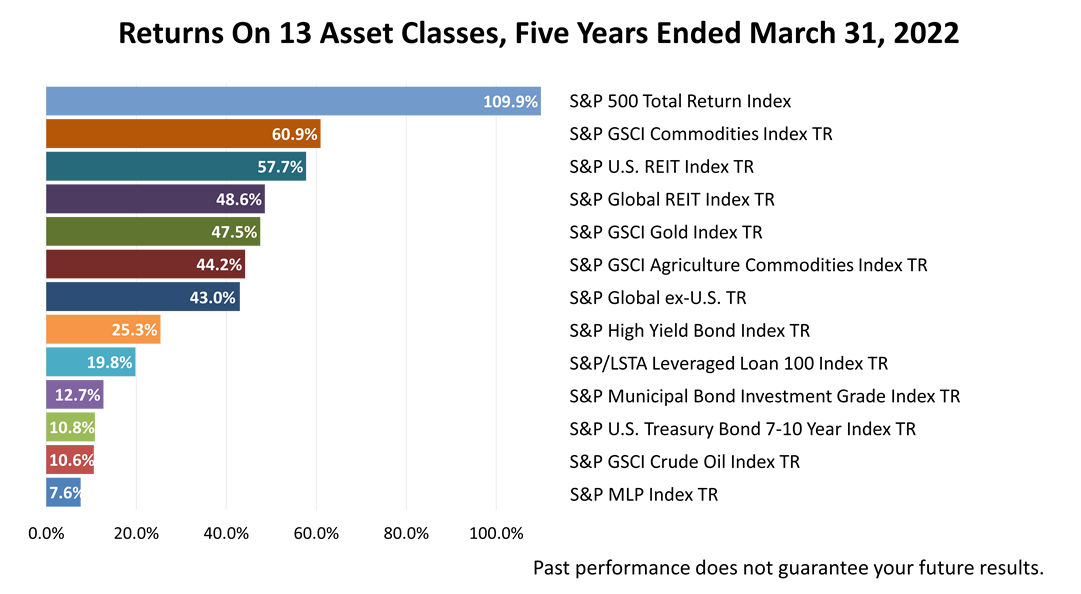
This bar chart showing the returns on a broad range of 13 different types of investments, aka asset classes, is important but it is a single piece of data to analyze and understand in planning a portfolio that could provide you with income through age 90 or 95. In providing comprehensive financial planning services, return statistics for five years are important enough to tell you the major takeaways from this chart:
Returns on U.S. stocks made other investments look bad. Foreign stocks returned 43% versus 110% on the Standard & Poor’s 500 stock index.
While oil prices have soared since Russia invaded Ukraine, oil stocks returned 10.6%. Intermediate U.S. Government Treasury bonds returned 10.8% in the five years shown.
Contact us if you’d like more information on the change in the stock market valuation paradigm.